Fix pyplot autoscale margins and bar extents#240
Conversation


Greptile SummaryThis PR updates pyplot autoscaling and label geometry to match Matplotlib-style margins. The main changes are:
Confidence Score: 5/5This PR appears safe to merge with low risk. The changes are focused on autoscale range propagation and render geometry, with broad tests for the affected pyplot, core, SVG/raster, and browser paths. No verified correctness or security issues were found in the changed code. No files require special attention.
 T-Rex Logs T-Rex LogsWhat T-Rex did
Important Files Changed
Reviews (7): Last reviewed commit: "Remove visual comparison asset" | Re-trigger Greptile |


Merging this PR will degrade performance by 26.24%
|
| Benchmark | BASE |
HEAD |
Efficiency | |
|---|---|---|---|---|
| ❌ | test_select_lasso_message_1m |
93.3 ms | 126.4 ms | -26.24% |
Tip
Investigate this regression by commenting @codspeedbot fix this regression on this PR, or directly use the CodSpeed MCP with your agent.
Comparing agent/fix-pyplot-autoscale-margins (06761bd) with main (960e132)

Footnotes
-
1 benchmark was skipped, so the baseline result was used instead. If it was deleted from the codebase, click here and archive it to remove it from the performance reports. ↩
![greptile-apps[bot]](https://avatars.githubusercontent.com/in/867647?s=60&v=4)

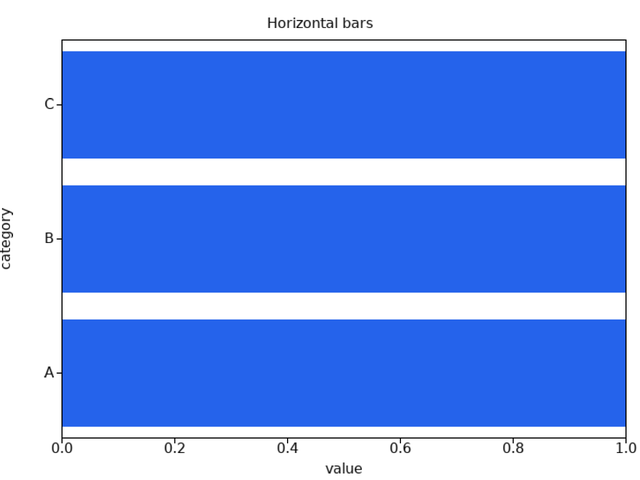
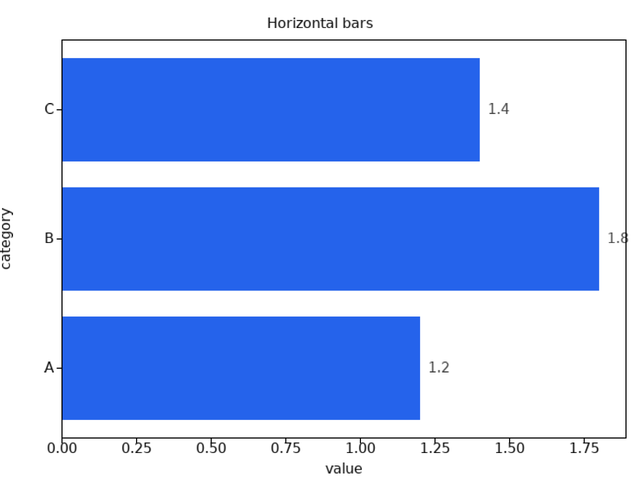
Before / after renderingsThese are the same pyplot gallery cases at the same normalized 640×480 output size. Before is the pre-PR behavior; after is this PR. Horizontal bars — full value/category extentsBefore, every bar is clipped to the fallback
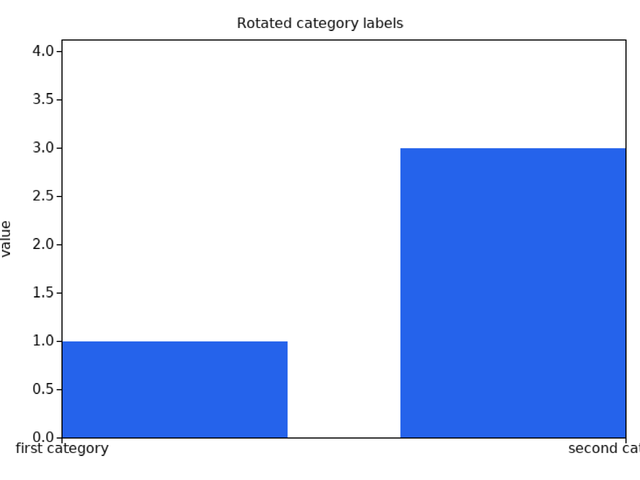
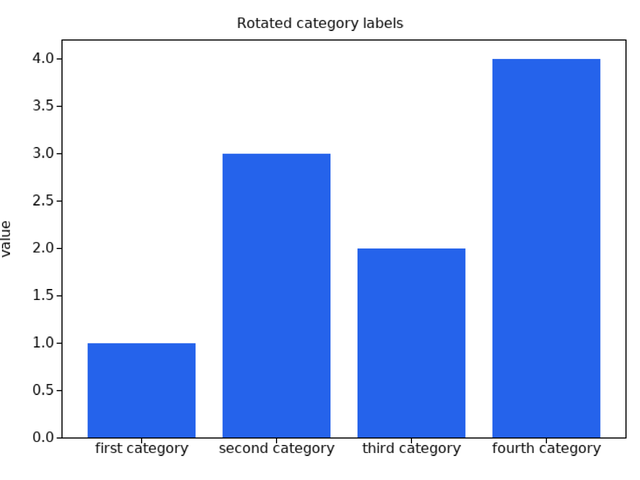
Rotated categorical bars — all categories remain in viewBefore, the fallback category domain shows only two of four bars. After, all four categories and the outer half-bar widths fit.
Positive bar labels — Matplotlib-style headroomBefore, the tallest value label crosses the top spine. After, the 5% autoscale margin keeps it inside the axes.
The largest changes are in the plot limits and bar visibility. This PR does not fix the separate tick-label-to-tick spacing/chrome issue; that remains visible in both sets. |
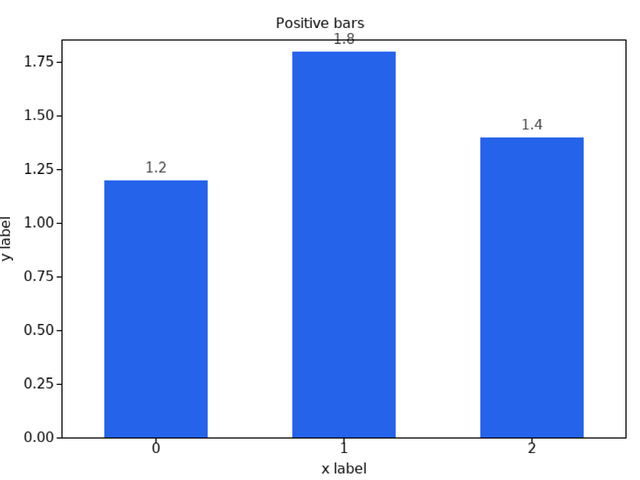
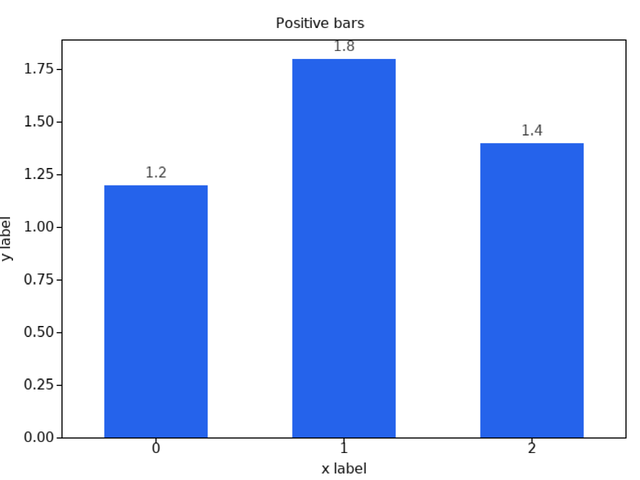

|
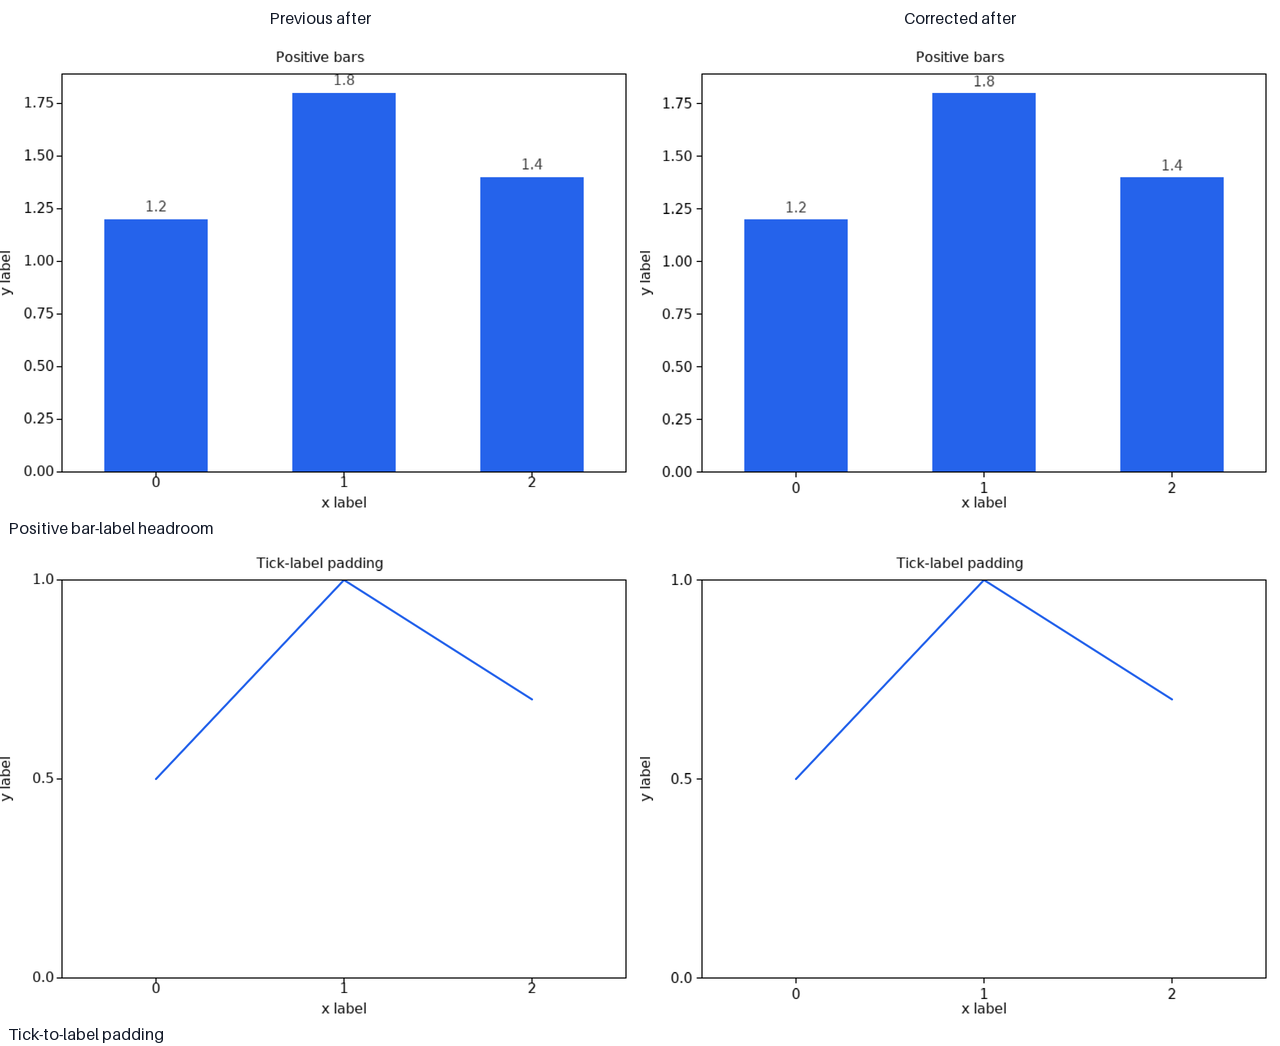
Follow-up on the annotation/tick-spacing review:
The corrected version now:
Pixel checks on the focused gallery cases:
Validation: 707 passed, 3 skipped, plus a focused headless Chromium geometry test for both tick padding and bottom-aligned annotations. |
1 participant

Summary
Validation
pytest -q tests/pyplot— 623 passed, 3 skippedruff check— passedruff format --check— passedgit diff --check— passedThe visual micro-suite also confirms line views now use the expected 5% limits and ordinary/stacked/horizontal bar labels remain inside the rendered view.