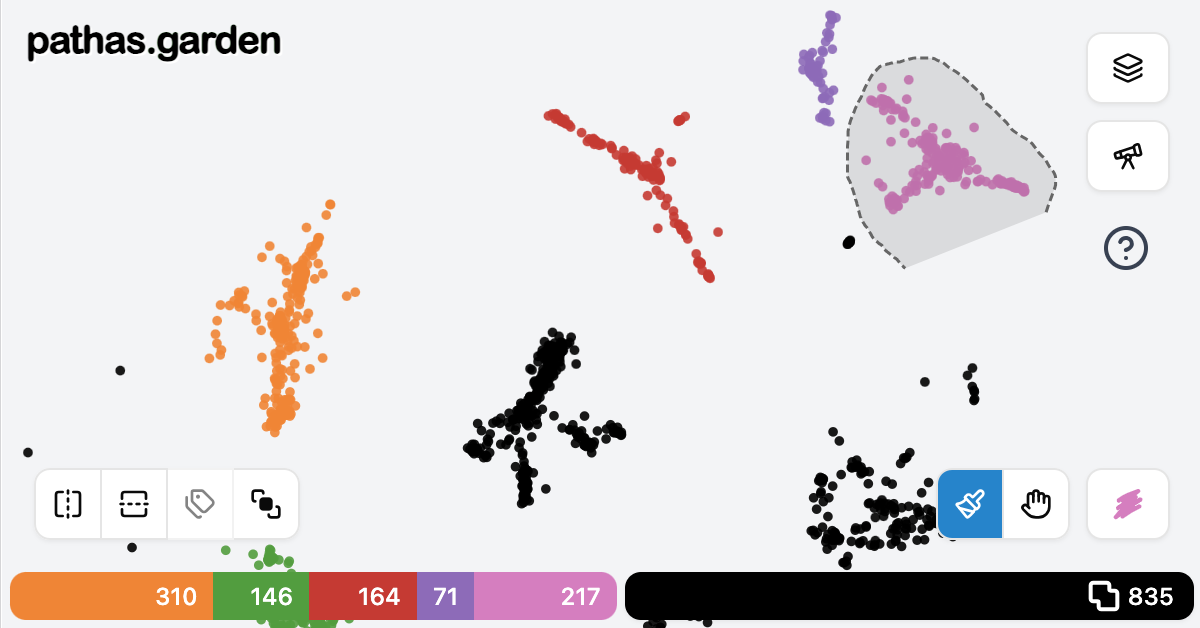
A map-like interface for exploring opinion landscapes.
Paint participant groups, reveal hidden consensus, and surface what divides us.
Built on polis-like opinion data. Runs entirely in the browser — no backend required.
Discord | Weekly Call Notes | Storybook | Interface Demos
![]()
This project is part of the broader Polislike community — a group exploring tools and ideas around computational democracy and opinion mapping.
- Join the Discord — chat with contributors and users
- Weekly call notes & schedule — we hold a regular open call; all are welcome
- Perspective map: D3-powered SVG scatter plot projecting participants into a 2D opinion space
- Group painting: Lasso tool to paint participant clusters and compare their voting patterns
- Vote heatmaps: Per-statement agree/disagree/pass overlays across the map
- Metrics layers: Vote-count and principal-component intensity visualizations
- Representative statements: Automatically surfaces distinguishing statements per painted group using in-browser DuckDB SQL
- h5ad import: Load any
.h5ad(AnnData) file directly in the browser — no server upload needed. Generate compatible files from Polis report URLs using the Streamlit export tool, or programmatically with the valency-anndata Python library - Parameter explorer: Side-by-side comparison of algorithm configurations for the data processing pipeline
- CSV export: Download vote data as CSV for further analysis
- Vite — build tooling and dev server
- React + TypeScript — UI framework
- D3 — SVG map visualization
- DuckDB-WASM — in-browser SQL queries over Parquet vote data
- h5wasm — in-browser HDF5/h5ad file reading
- shadcn/ui (new-york style) + Radix UI — accessible UI components
- Tailwind CSS v4 — utility-first styling
- Storybook + Chromatic — component development and visual regression testing
- Vitest — unit testing
| Paint colored groups of participants onto perspective map | For any statement, see participant votes on map |
|---|---|
 |
 |
| See which statements differentiate groups | See which statements straddle all groups |
|---|---|
 |
 |
| Download participant data or vote data to CSV | View any participant data layer on any projected map |
|---|---|
 |
 |
| View continuous data layers mapped onto participants | View discrete categorical data layers mapped onto participants |
|---|---|
 |
 |
| Select and animate between different map projections |
|---|
↓ links to video  |
Prototype explorations hosted on Storybook:
- Magic Paint — auto-paint participant clusters by sweeping hierarchical clustering thresholds
- Routing — route a path through the urban and rural parts of the latent space of human values
- Concave Hulls — draw concave hull boundaries around painted groups
- Node.js (see
.nvmrcorpackage.jsonfor version) npm
git clone https://github.com/patcon/polislike-human-cartography-prototype-v2.git
cd polislike-human-cartography-prototype-v2
npm install
npm run dev
The app will be available at http://localhost:5173.
npm run build        # TypeScript check + production build
npm run test         # Vitest in watch mode
npm run test:run     # Vitest single run (CI)
npm run lint         # ESLint
npm run storybook # Storybook on port 6006See docs/data-format.md for the full .h5ad (AnnData) file format the app expects.
Contributions are welcome! This project is developed with the assistance of Claude Code, which means a well-written GitHub issue is often enough to get a feature built or a bug fixed — no code required from contributors.
To contribute:
- Open an issue describing the feature or bug clearly. Include context, expected behaviour, and any relevant examples or screenshots.
- If you want to take a crack at it yourself, fork the repo, make your changes on a feature branch, and open a pull request referencing the issue.
- For discussion or questions, use the issue tracker or join the Discord.
The clearer the issue spec, the easier it is to hand off to an AI-assisted workflow. Think of a good issue as a mini design doc: what problem does it solve, and how should it behave when done?